
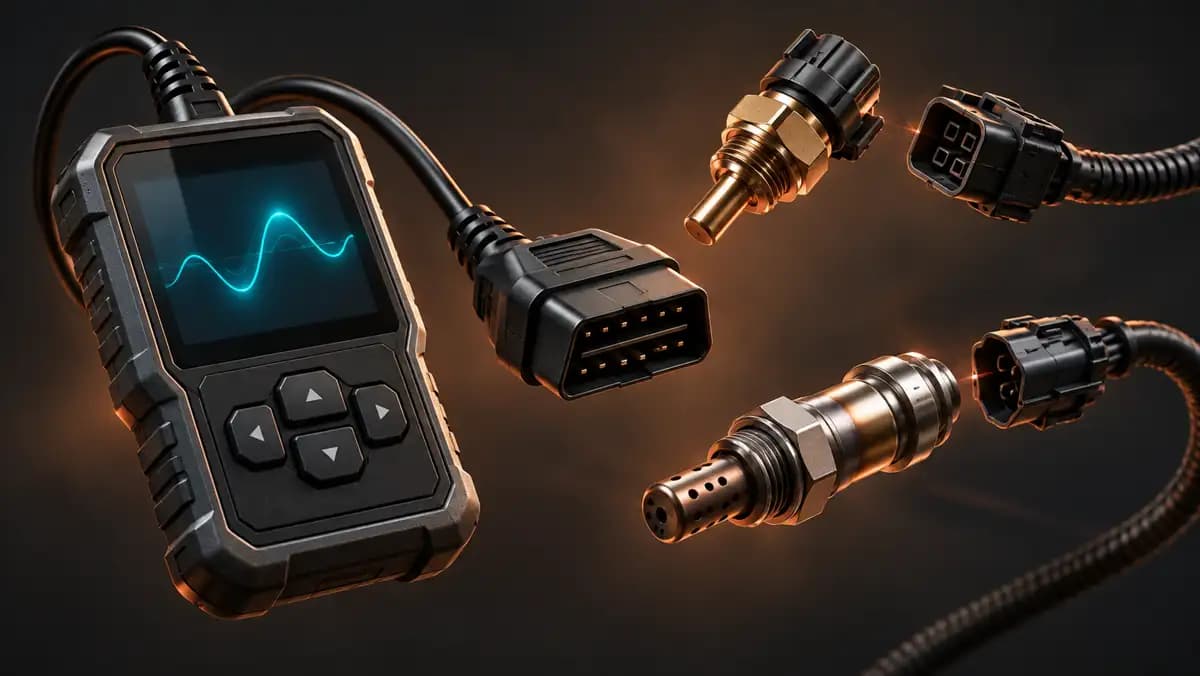
A scan tool can display dozens or hundreds of parameters. More data does not automatically create a better diagnosis. The goal is to choose a small group of related values, observe them under a known condition, and ask whether they tell a consistent story.
Begin with the operating condition
Before judging a value, record whether the engine is cold or warm, idling or loaded, in open or closed loop, and whether electrical or climate-control loads are active. A normal value in one condition may be suspicious in another.
Freeze-frame data is especially useful because it captures the conditions present when a fault was stored. Save it before clearing codes.
Compare relationships, not isolated numbers
For a fuel-mixture concern, useful data might include short- and long-term fuel trim, oxygen or air-fuel sensor behavior, airflow, manifold pressure, coolant temperature, engine speed, and calculated load.
For a cooling concern, graph coolant temperature alongside vehicle speed, fan command, intake-air temperature, and perhaps heater behavior. For a charging concern, compare system voltage with engine speed and electrical load.
The important question is often not “Is this number inside a generic range?” but “Does this number change when the system command and physical condition change?”
Three habits that prevent bad conclusions
- Verify units. Celsius and Fahrenheit, kPa and psi, grams per second and pounds per minute can make the same data look completely different.
- Know what the parameter represents. “Commanded” and “actual” are not interchangeable.
- Check vehicle-specific information. Generic OBD data is valuable, but manufacturer data definitions and normal behavior can differ.
Build a repeatable test
Warm the vehicle when appropriate, select only the relevant parameters, and record a short sequence at idle, steady speed, and controlled load. Change one condition at a time. If possible, compare the suspicious signal with a known-good mechanical measurement or electrical test.
Live data is strongest when it confirms a physical test. It is weakest when one strange-looking number is used to condemn an expensive component.
Sources and further reading
General educational guide
For information, not a diagnosis or repair instruction. Vehicle-specific checks are still required. Consult the manufacturer's guidance and a qualified technician.
How to use this information
This article explains general principles and does not establish what is wrong with your vehicle. Illustrations are conceptual. Read the content limitations.
Content and reuse
An AI-assisted educational explanation prepared for AI4Car. References provide factual context; linking to a publication does not grant a license to its text or images or imply its author’s endorsement. No Creative Commons license is asserted for those third-party materials.
Illustration: AI-generated for AI4Car; a generic conceptual view, not a photograph of the reported vehicle or a manufacturer’s diagram. Content and licensing policy.
Was this useful?
Discussion
Share what you checked, what changed, and which vehicle you drive. Up to 10 comments and replies per account in 24 hours.
Loading discussion…